Course: Information Visualization
Project type: “This vs. that” comparison, individual project
The assignment
Overview
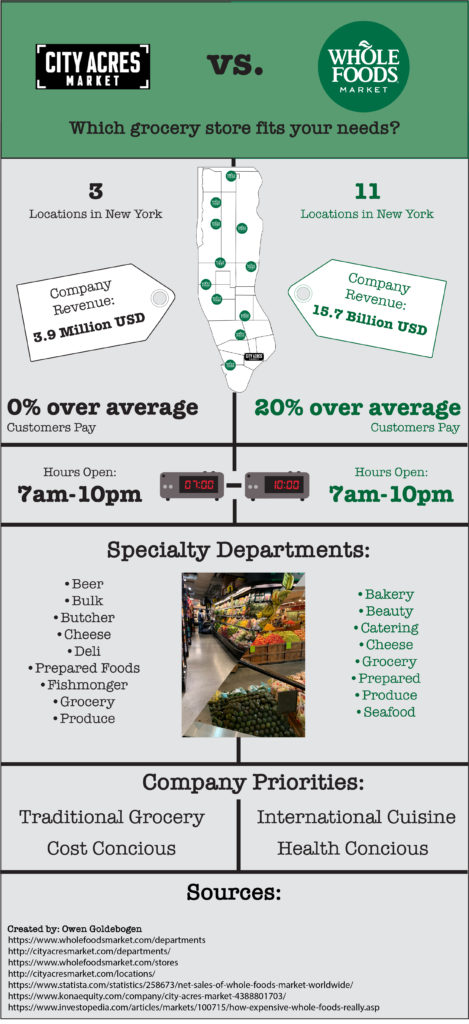
Create a “this vs. that” infographic, displaying one or more facets of comparison between two related items in the topic of your choice.
The focus of this project was conducting research and rapid iteration.
Topic selection
I often shop at two stores in my neighborhood, and realized that exploring the similarities and differences would allow me to identify the reasons someone might choose one over the other for some or all of their grocery shopping needs.
The project
Select topic
I often shop at two stores in my neighborhood, and realized that exploring the similarities and differences would allow me to identify the reasons someone might choose one over the other for some or all of their grocery shopping needs.
Conduct site visits
I conducted several site visits at each store, observing customers, documenting floor space usage, and identifying how each store’s product placement and layout was designed to attract their target customer.
Identify themes
In looking at the data I collected, there were several key areas that people might use to select the “right” grocery store for their needs, depending on their priorities.
Select data sets
From the fourteen data sets I collected, I chose six, including both quantitative and qualitative data types, that I felt represented a diverse set of decision-making options.
First draft visualization
I then used Adobe Photoshop and Illustrator to create my first draft, working to select the best way to represent each piece, while also working to create a cohesive final product.
Peer critique
After presenting my concept and first draft, classmates provided feedback on the project’s strengths and weaknesses.
Revise and iterate
Taking this feedback, I continued to refine and develop my infographic to ensure that all aspects were immediately understandable.
Finalize and present
The final phase included presenting the final product for presentation and critique.
Software used
Adobe Photoshop
Adobe Illustrator
Adobe Bridge
Skills demonstrated
Primary research gathering (in-person site visits)
Secondary research gathering (web-based research)
Data analysis
2D layout
Rapid iteration


